produktach i klientach do
podnoszenia rentowności
skalowania sprzedaży
pozyskania nowych klientów
planowania rozwoju
Zaufali nam
Wyróżnieni przez


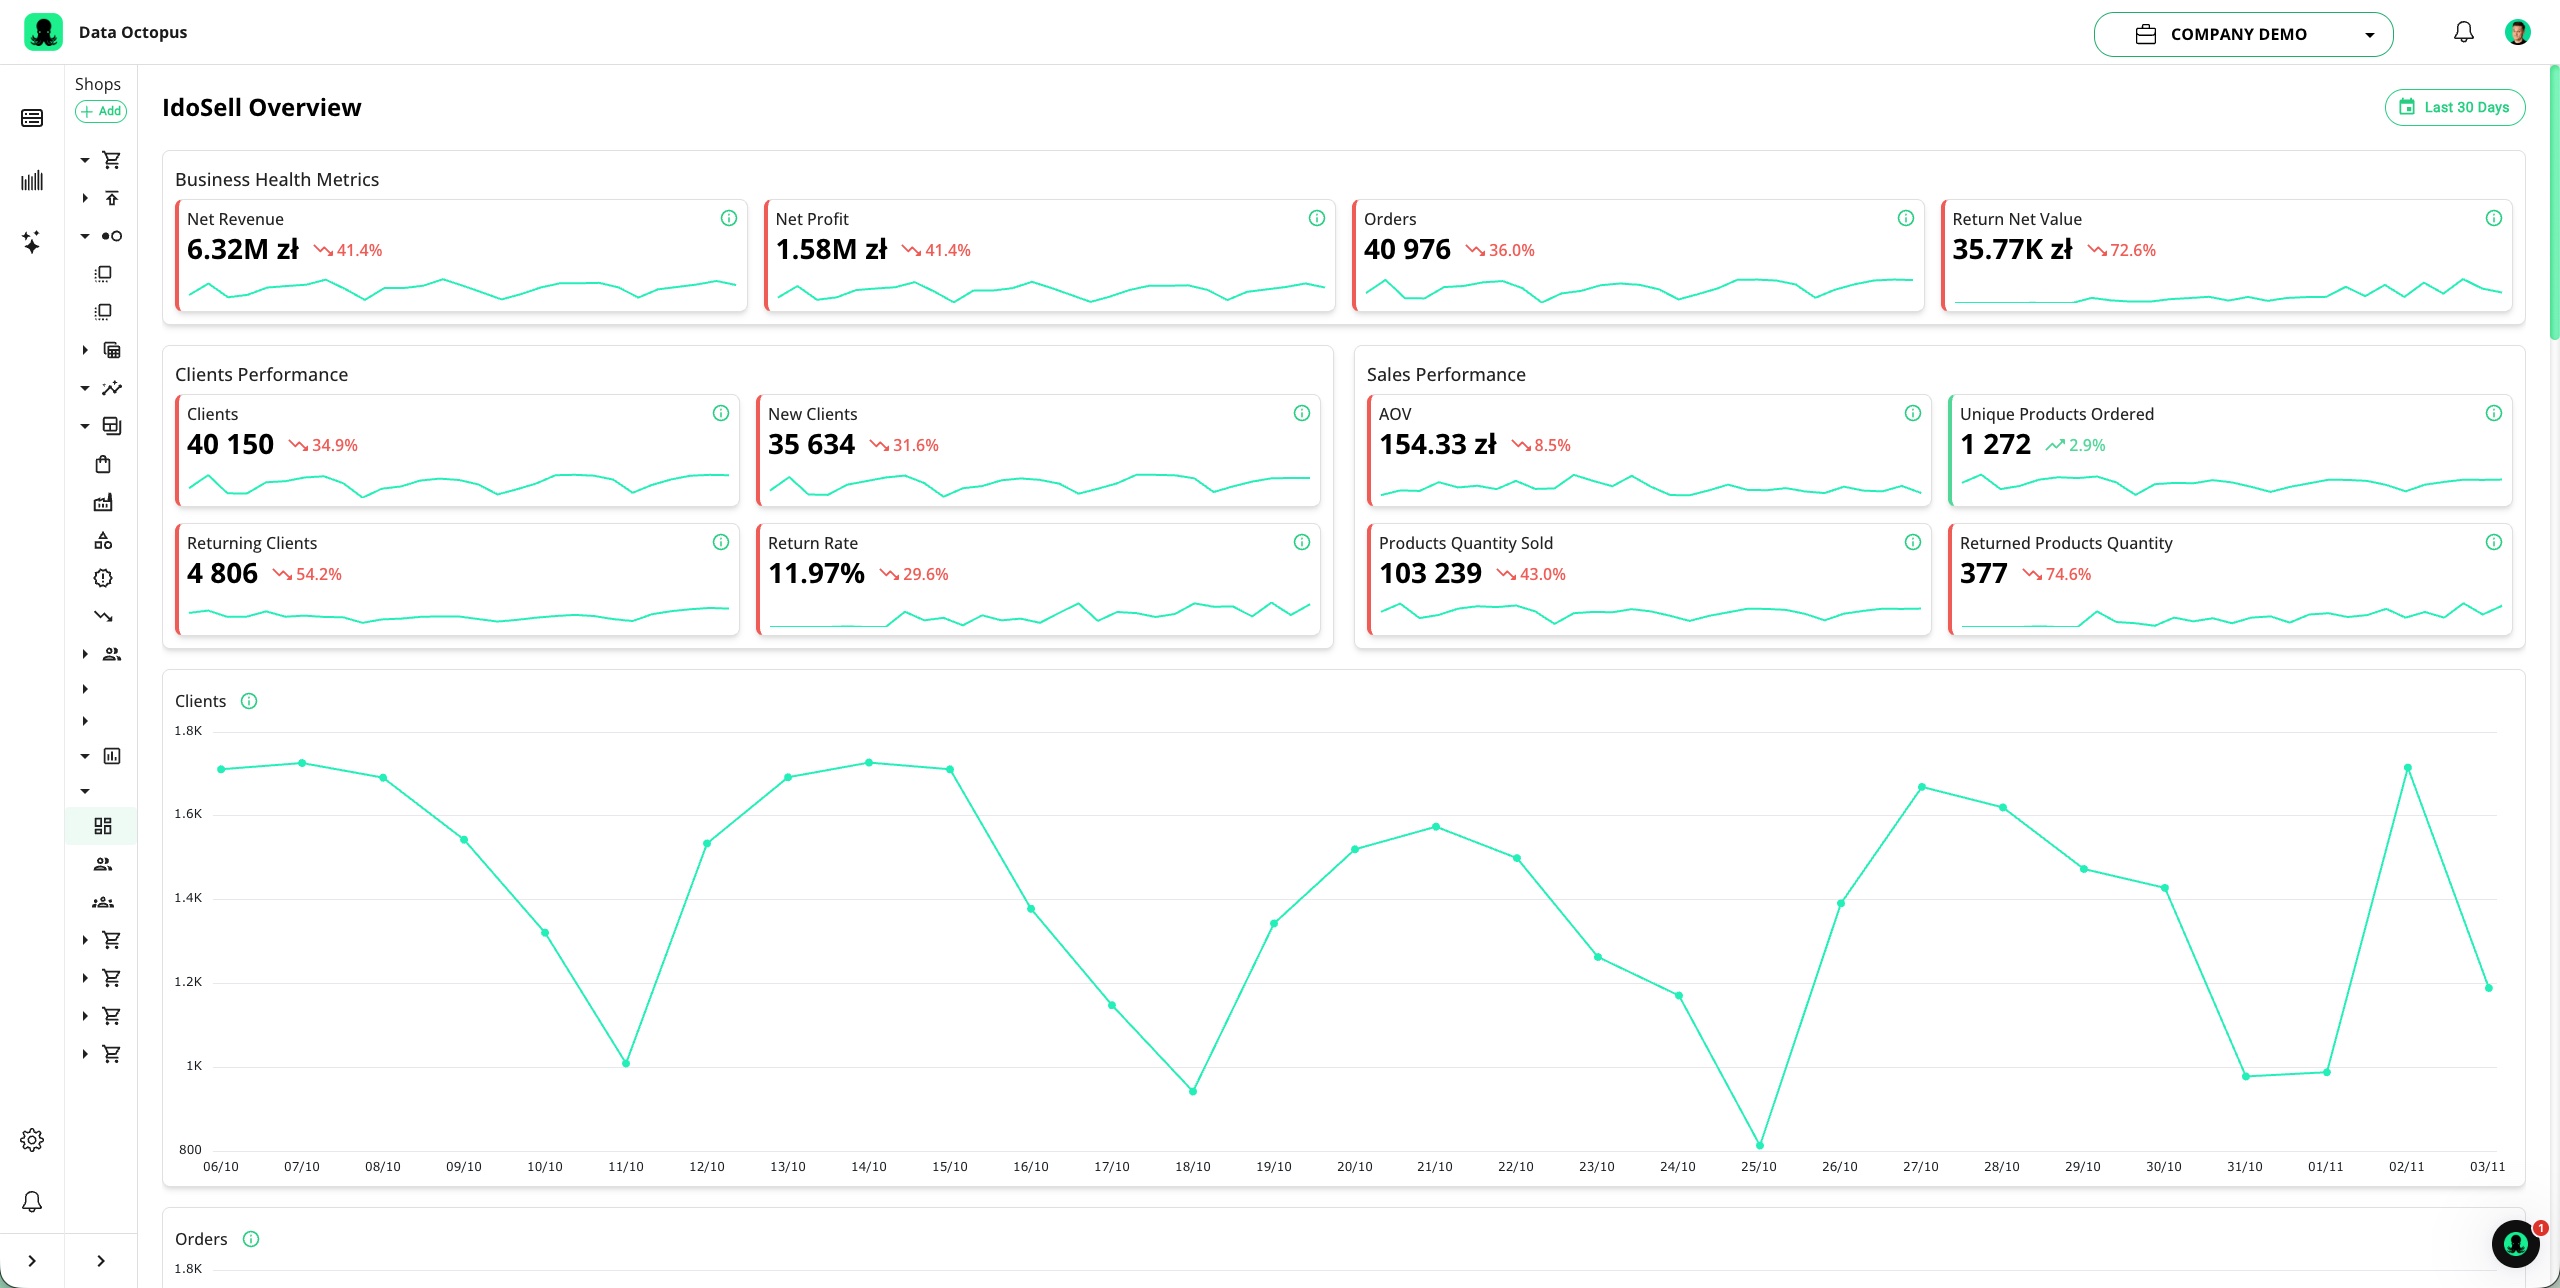
Kluczowe dane o sprzedaży marek, kategorii i produktów w jednym miejscu
Zaawansowany Feed Marketing
i raportowanie efektywności produktów
z kluczowych kanałów
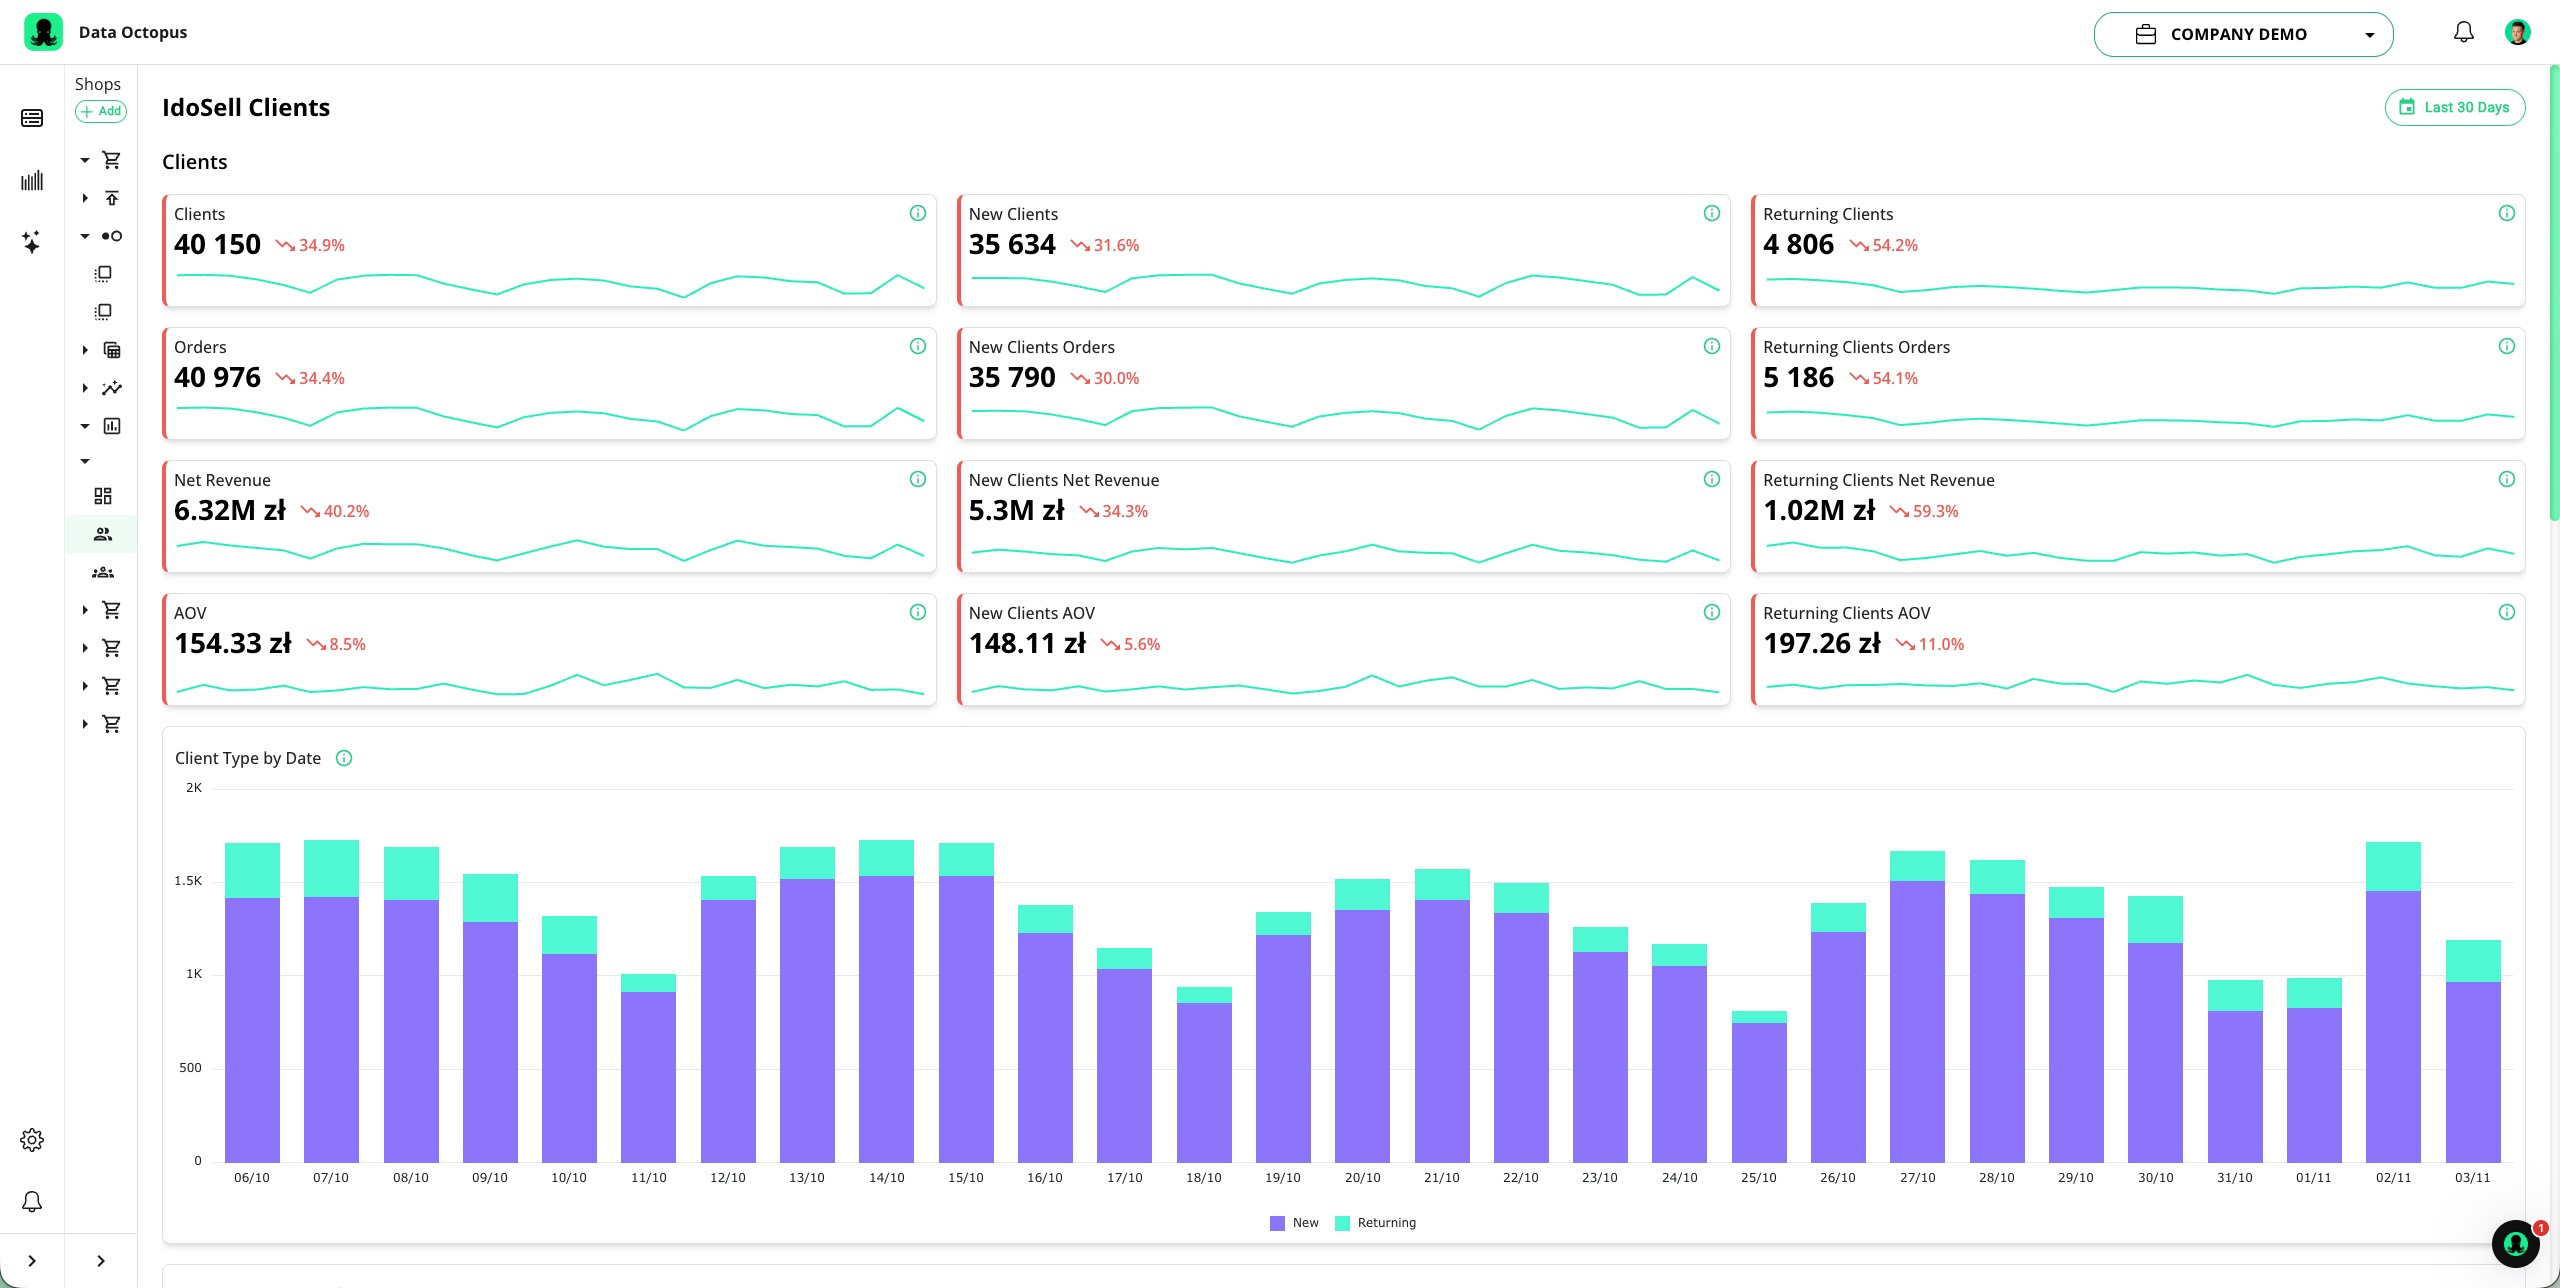
Kluczowe KPI i predykcje w jednym miejscu
Dostęp do surowych danych ze wszystkich integracji


odpowiedzialnych za performance i analitykę
- Posiadasz duże SKU – najlepiej liczone
w dziesiątkach lub setkach tysięcy produktów. - Sprzedajesz poprzez Google Shopping i inne
kanały reklamowe – idealnie na wielu rynkach. - Posiadasz dużo rozproszonych danych o produktach
i nie masz czasu oraz zasobów na ich analizę ręczną. - Chcesz ograniczyć zapotrzebowanie na zasoby
IT oraz data analyst w obszarze performance marketingu i analityki. - Posiadasz w ofercie produkty o różnej marży
a zarządzanie nią jest dla Ciebie ważne.
- Szereg automatyzacji przyspieszających operacje na feedach produktowych.
- Struktura kont, projektów i dostępów dostosowana pod agencyjny model pracy.
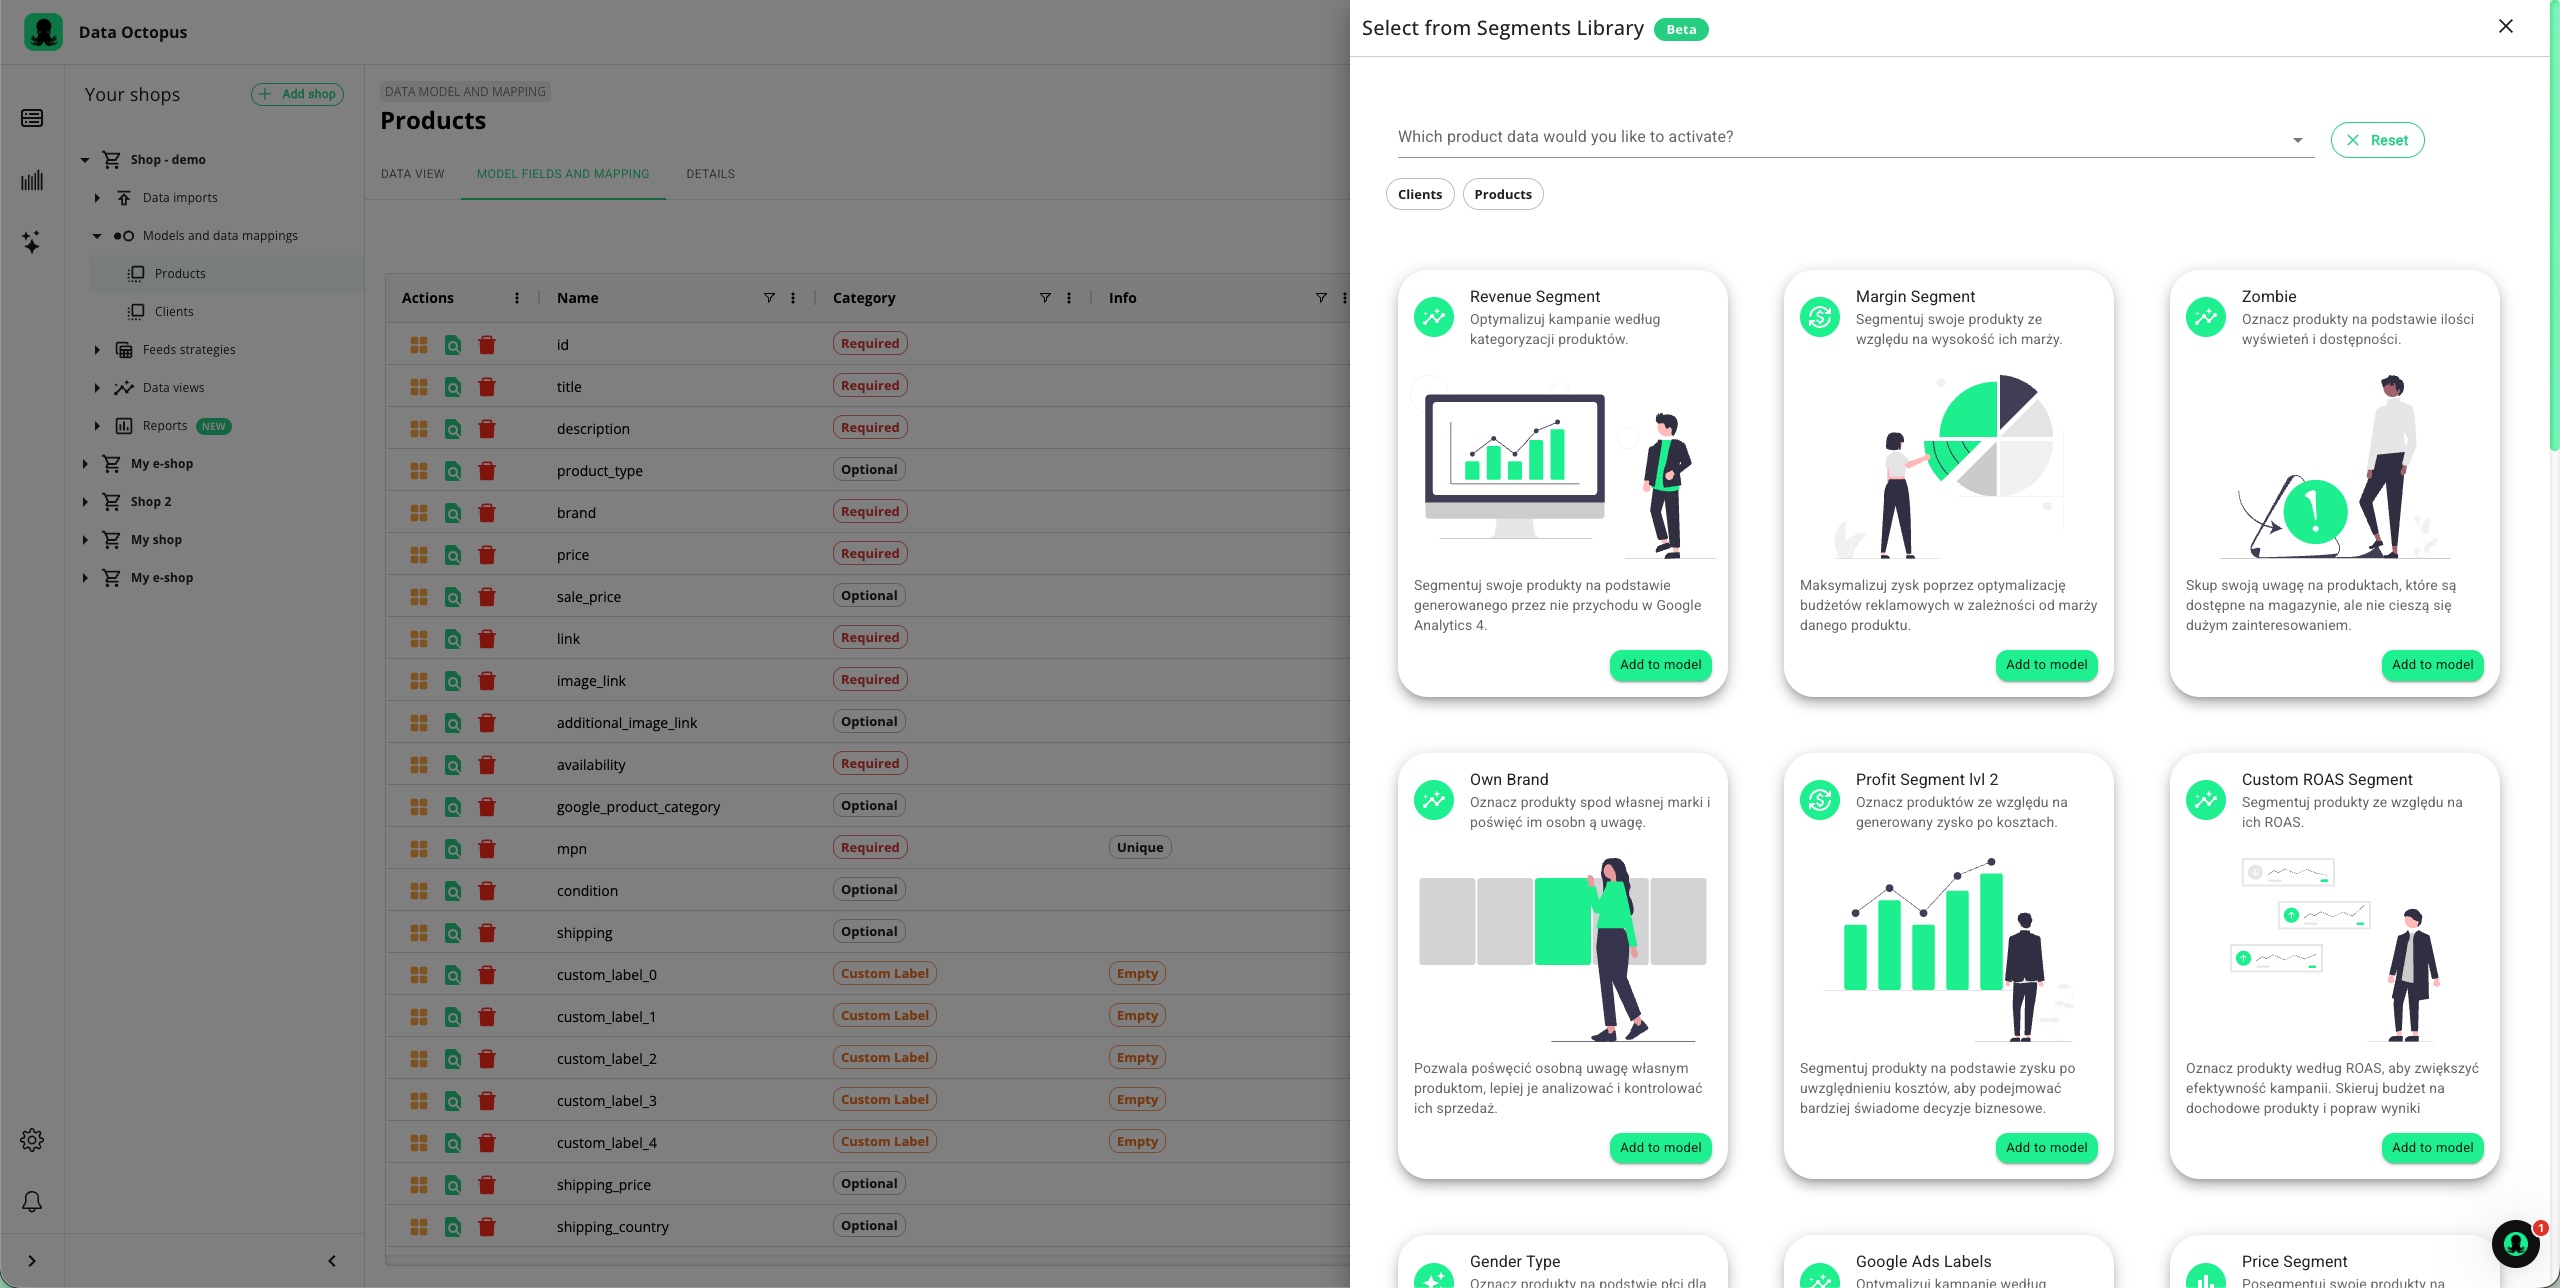
- Gotowe repozytorium Product Fields Library dzięki czemu obniżasz próg niezbędnego doświadczenia do segmentowania produktów w oparciu o dane.
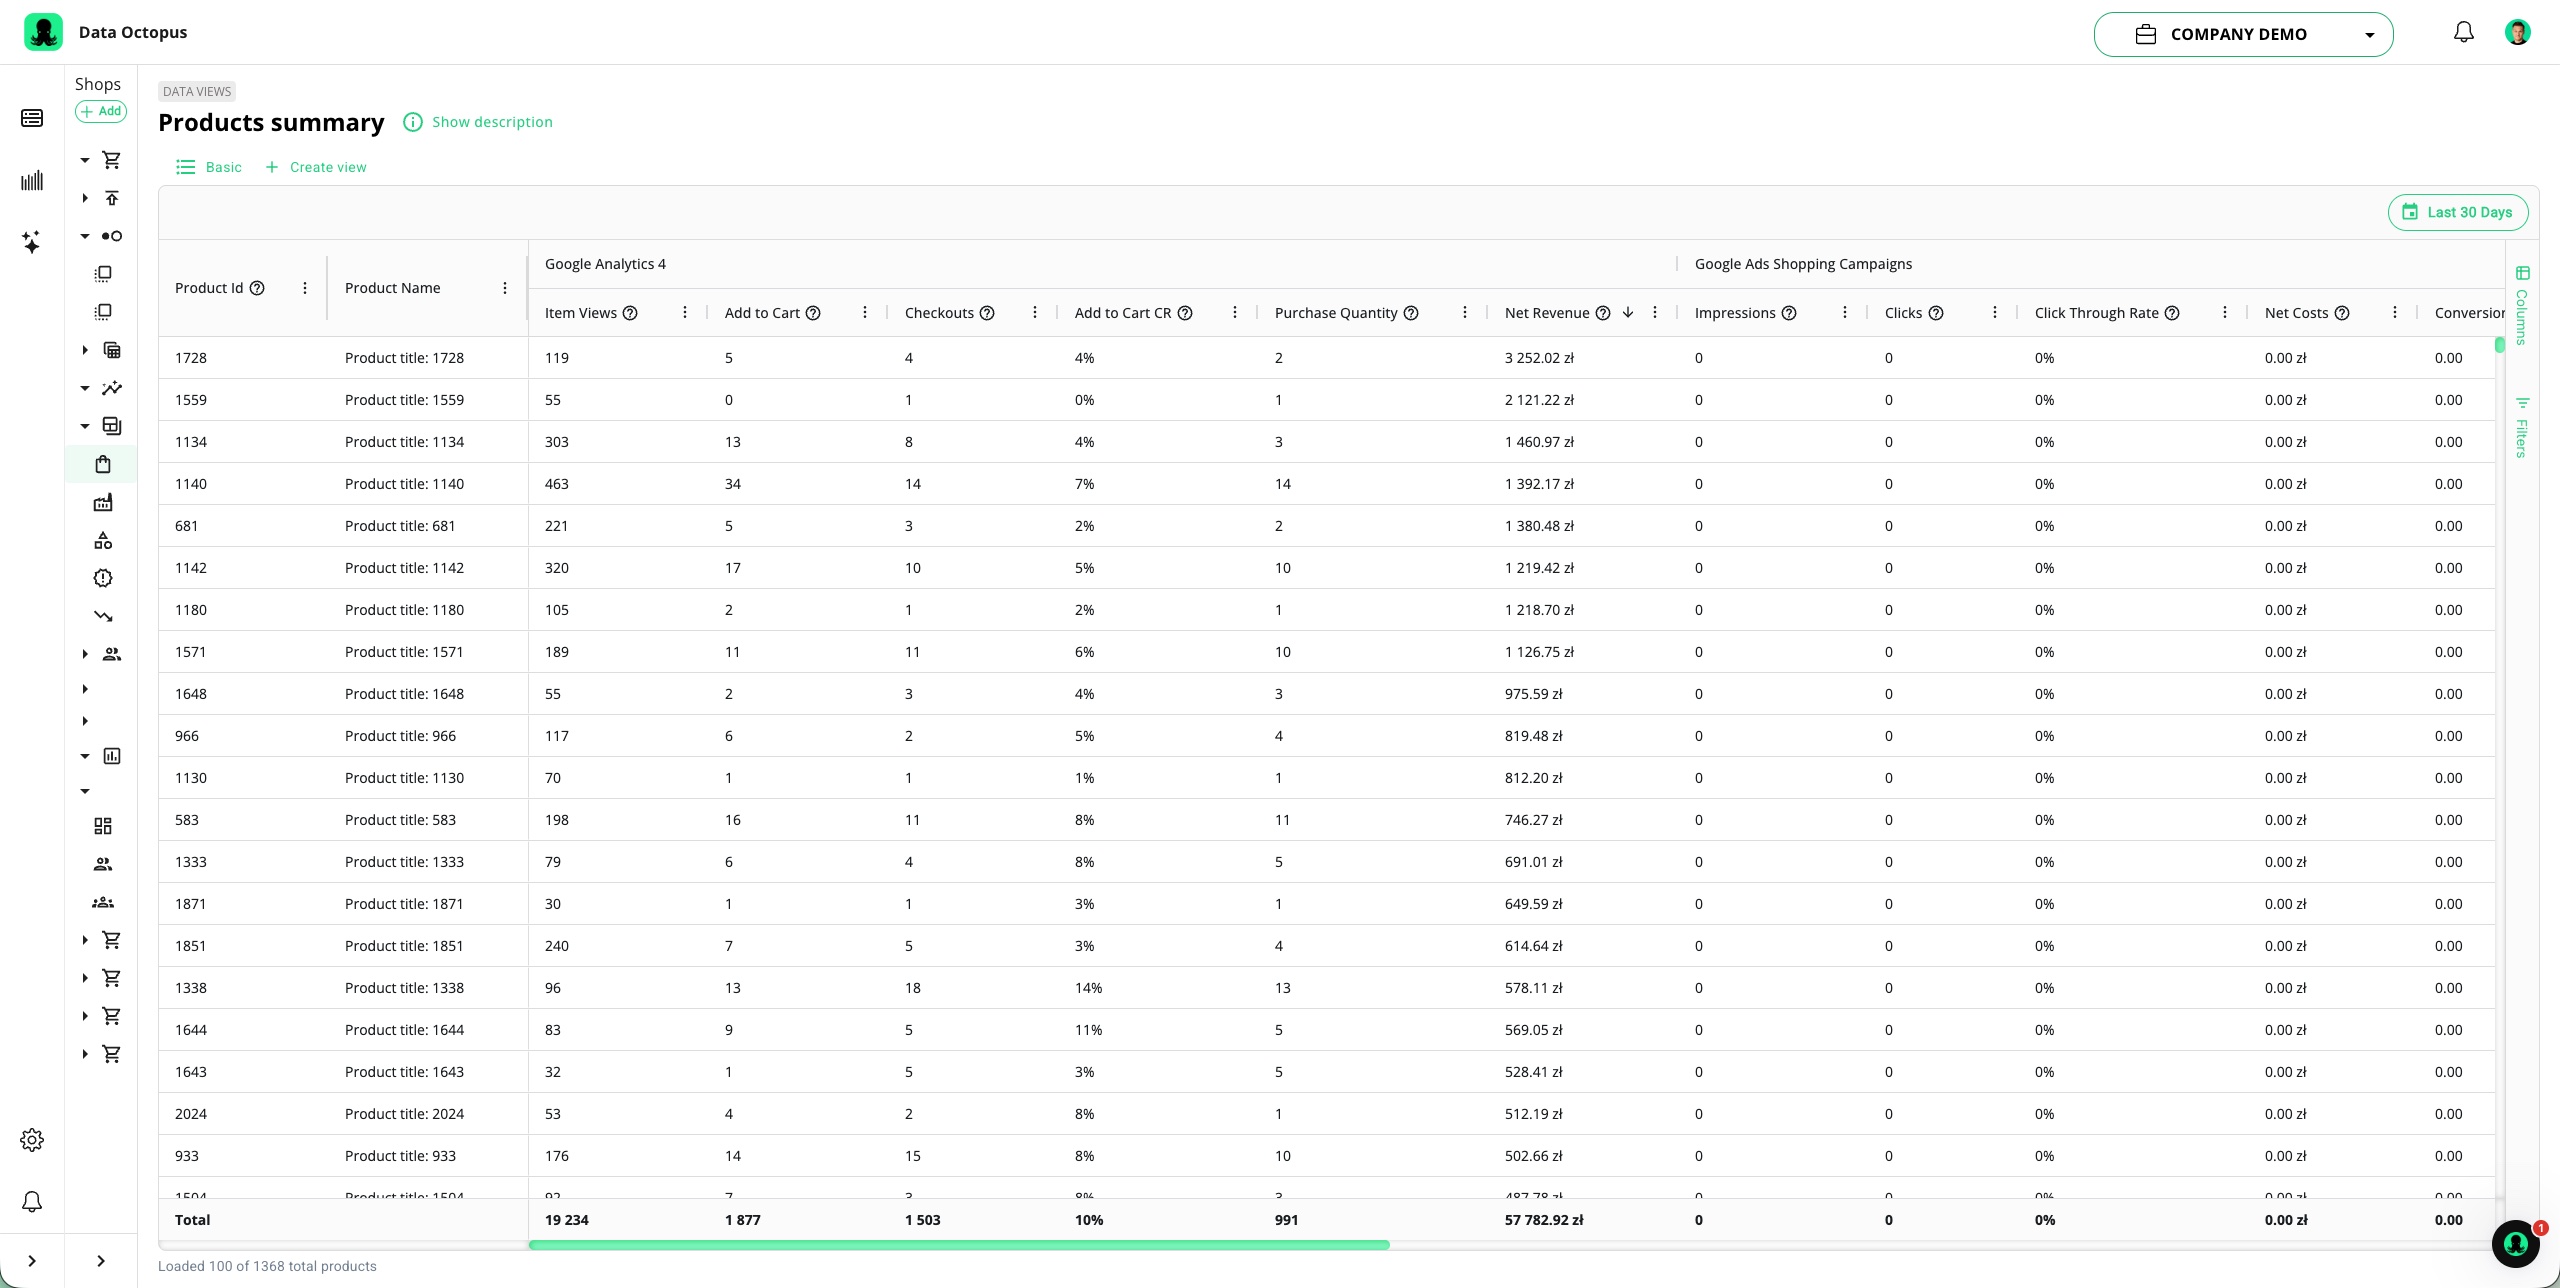
- Master raport agregujący kluczowe dane o sprzedaży produktów co usprawni raportowanie Twojej pracy.
- Ograniczenie potrzeb związanych z posiadaniem zasobów IT oraz digital analyst.
- Eliminacja potrzeby inwestycji czasu i pieniędzy we własne rozwiązania chmurowe w obszarze Business Intelligence i Feed Marketingu.
- Głęboka customizacja w efekcie setek aplikacji w ramach Google Cloud Marketplace pracujących niczym gotowe komponenty do tuningu Twojego e-commerce.
- Zaawansowane operacje na dużych zbiorach danych produktowych.
- Gotowe repozytorium Product fields library – stworzone przez ekspertów PPC takich jak Ty.
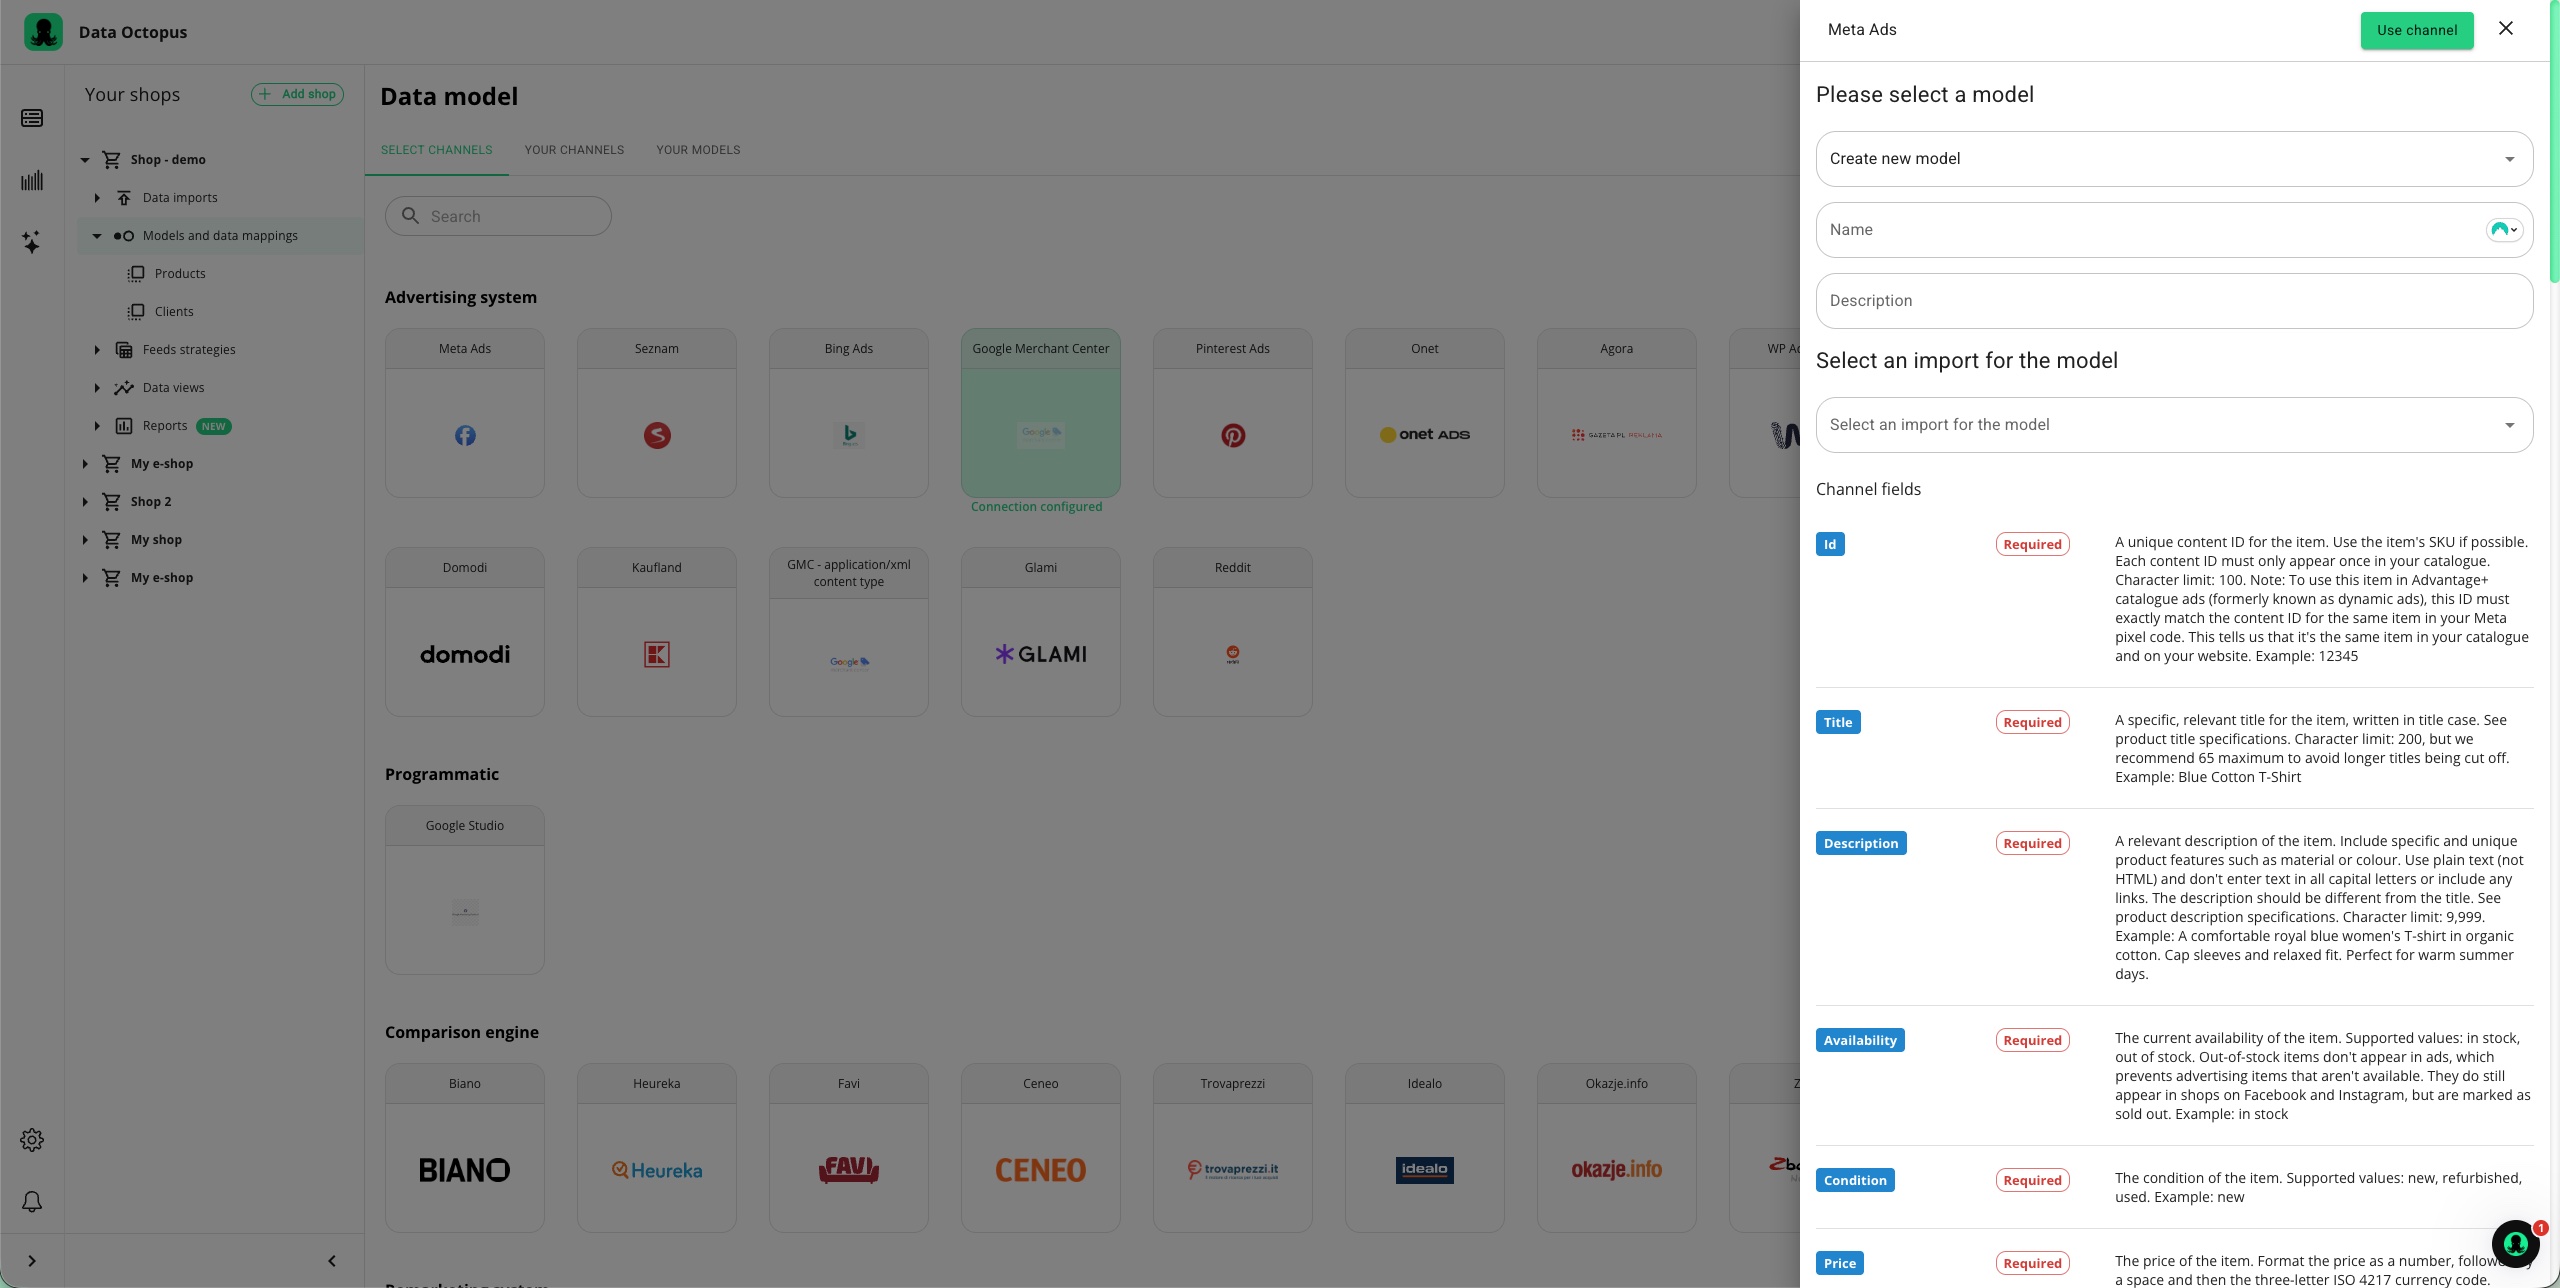
- Dziesiątki integracji zarówno wejściowych jak i wyjściowych, dzięki którym szybko i bezpiecznie rozpoczniesz sprzedaż poprzez nowe kanały na kolejnych rynkach.
- Raporty łączące kluczowe dane o produktach z kilku źródeł.
- Natywną integrację i wykorzystanie Google Looker Studio do budowy środowiska Business Intelligence.
- Gotowe repozytorium szablonów dashboards dla e-commerce co przyśpieszy budowę systemu raportowego.
- Dostęp do Model garden w ramach Big Query ML i Vertex AI co umożliwi niedostępne wcześniej analizy i zwiększy użyteczność danych.
odpowiedzialnych za performance i analitykę
- Posiadasz duże SKU – najlepiej liczone
w dziesiątkach lub setkach tysięcy produktów. - Sprzedajesz poprzez Google Shopping i inne
kanały reklamowe – idealnie na wielu rynkach. - Posiadasz dużo rozproszonych danych o produktach
i nie masz czasu oraz zasobów na ich analizę ręczną. - Chcesz ograniczyć zapotrzebowanie na zasoby
IT oraz data analyst w obszarze performance marketingu i analityki. - Posiadasz w ofercie produkty o różnej marży
a zarządzanie nią jest dla Ciebie ważne.

- Szereg automatyzacji przyspieszających operacje na feedach produktowych.
- Struktura kont, projektów i dostępów dostosowana pod agencyjny model pracy.
- Gotowe repozytorium Product Fields Library dzięki czemu obniżasz próg niezbędnego doświadczenia do segmentowania produktów w oparciu o dane.
- Master raport agregujący kluczowe dane o sprzedaży produktów co usprawni raportowanie Twojej pracy.

- Ograniczenie potrzeb związanych z posiadaniem zasobów IT oraz digital analyst.
- Eliminacja potrzeby inwestycji czasu i pieniędzy we własne rozwiązania chmurowe w obszarze Business Intelligence i Feed Marketingu.
- Głęboka customizacja w efekcie setek aplikacji w ramach Google Cloud Marketplace pracujących niczym gotowe komponenty do tuningu Twojego e-commerce.

- Zaawansowane operacje na dużych zbiorach danych produktowych.
- Gotowe repozytorium Product fields library – stworzone przez ekspertów PPC takich jak Ty.
- Dziesiątki integracji zarówno wejściowych jak i wyjściowych, dzięki którym szybko i bezpiecznie rozpoczniesz sprzedaż poprzez nowe kanały na kolejnych rynkach.
- Raporty łączące kluczowe dane o produktach z kilku źródeł.

- Natywną integrację i wykorzystanie Google Looker Studio do budowy środowiska Business Intelligence.
- Gotowe repozytorium szablonów dashboards dla e-commerce co przyśpieszy budowę systemu raportowego.
- Dostęp do Model garden w ramach Big Query ML i Vertex AI co umożliwi niedostępne wcześniej analizy i zwiększy użyteczność danych.

produktach i klientach z wielu źródeł.
Automatycznie
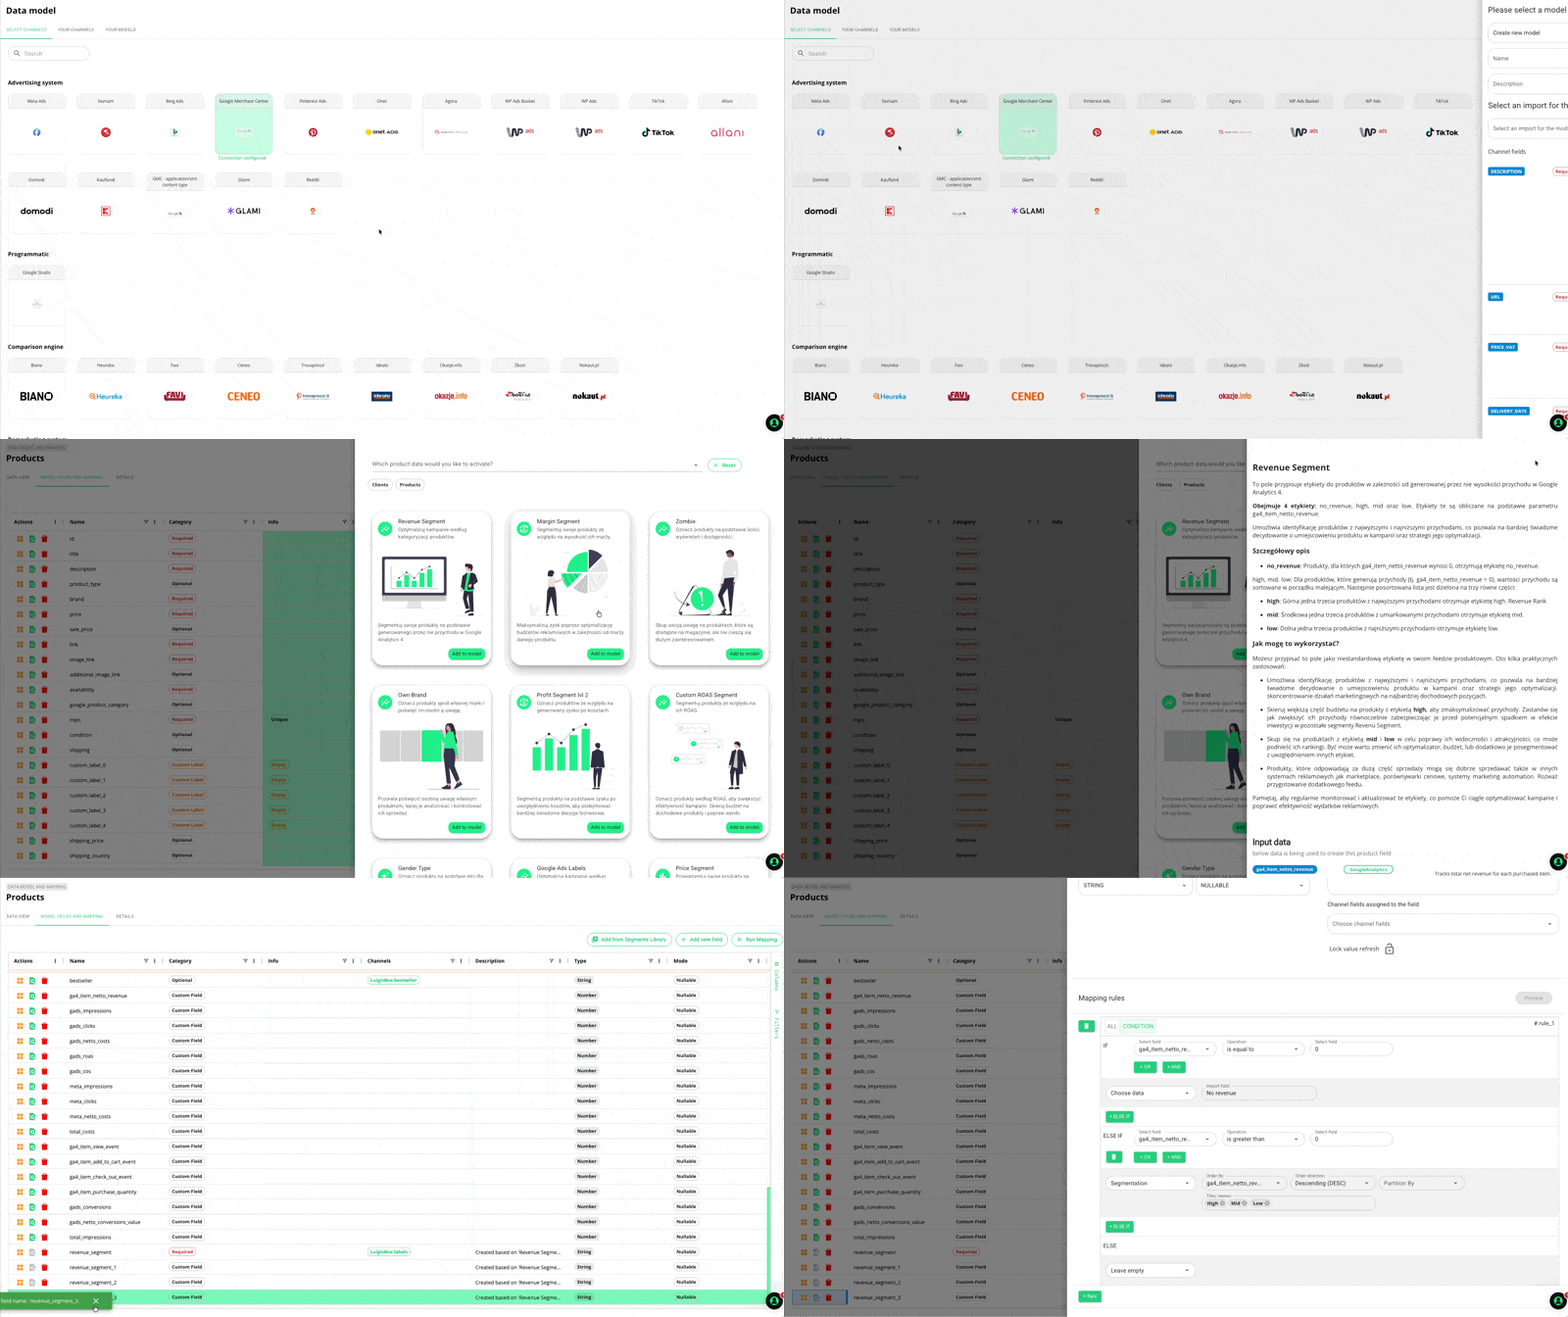
Data Octopus pozwoli Ci na głęboką segmentację produktów oraz klientów na bazie danych z kluczowych źródeł jak silnik e-commerce, systemy reklamowe czy analityczne. Dodatkowo szybko stworzysz pliki produktowe dla ponad 40+ platform reklamowych, za które te będą Ci wdzięczne. Wreszcie dobierzesz strategie reklamowe dopasowane do produktów i klientów na bazie danych, a nie odczuć.
dzięki najważniejszym danym w jednym miejscu.
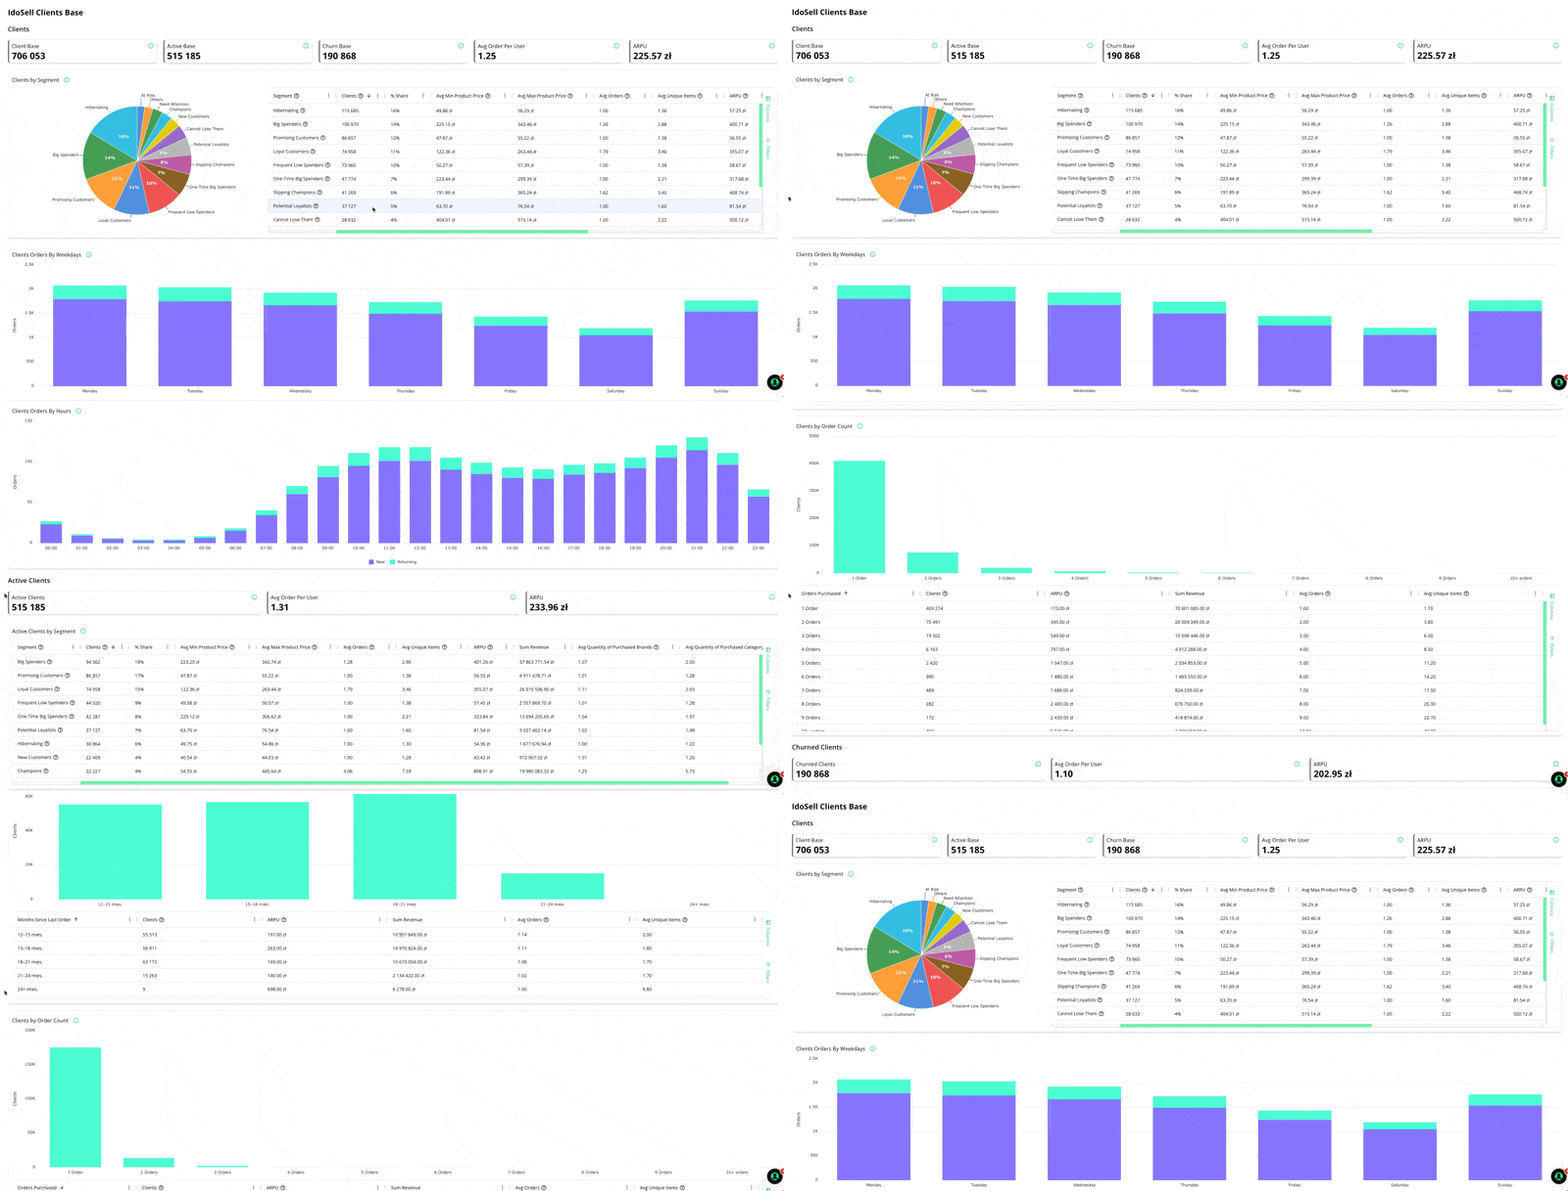
Data Octopus działa niczym nowoczesna hurtownia danych połączona z warstwą wizualną. Kluczowe dane efektywnościowe o produktach, kategoriach, markach, klientach w jednym miejscu. Szereg raportów pozwalających po kilku kliknięciach mieć dane w dowolnym zakresie dat z silnika e-commerce, systemów reklamowych, analitycznych i wielu innych źródeł. Kopalnia wiedzy dla działów digital marketing, oszczędność czasu i znaczne przyśpieszenie.
poprawy wyników e-commerce



Skondensowaliśmy ponad 10 letni Know How w obszarze pracy
z danymi o produktach na kontach reklamowych dla e-commerce.
Na starcie dostajesz dostęp do autorskiego modelu danych, który zawiera ponad 60 kolumn dla każdego z produktów.
Model jest oparty na najważniejszych systemach reklamowych, analitycznych z punktu widzenia segmentacji produktów
i inwestowania w te najbardziej strategicznie opłacalne.


Natywne połączenie z szybko zyskującą na znaczeniu i popularności hurtownią danych, jaką jest Google BigQuery wyróżnia Data Octopus na rynku. Koniec z półśrodkami. Komunikujemy się z Google BigQuery obustronnie w czasie rzeczywistym bez pośredników.


analitycznych dla e-commerce


przedaż online i offline wreszcie
mówią jednym językiem
- językiem danych

przyśpieszający "AHA" moment
Nasi klienci używają Data Octopus zwykle do takich celów jak:
- Skupienie budżetu na produktach najbardziej opłacalnych.
- Dywersyfikacja sprzedaży poprzez zwiększenie % oferty, który w niej uczestniczy
- Zwiększenie albo zmniejszenie udziału w sprzedaży konkretnych marek, kategorii lub innych segmentów produktów.
- Segmentacja produktów w oparciu o marżę i wykorzystanie jej kontekstu w celu podniesienia rentowności sprzedaży.
-Zabezpieczenie kluczowych danych o produktach w BigQuery oraz przygotowanie ich do spotkania z AI.
- Dane o produktach powinny pochodzić z kolejnych źródeł jak system magazynowy czy silnik e-commerce a dopiero 15% marketerów wykorzystuje więcej niż 1 źródło danych o produkcie do robienia feedów.
- Na końcu dla dla e-commerce liczy się zysk. Jedynie 2,5% marketerów segmentujących produkty w ofercie wykorzystuje kontekst marży do tego aby optymalizować sprzedaż nie tylko pod COS/ROAS ale też zysk właśnie.
- Coraz więcej danych oraz źródeł je generujące wymuszą nowoczesną architekturę przechowywania danych opartą o chmurę. Już 78% firm w USA wdrożyło rozwiązania chmurowe w swoich organizacjach. W PL jest to narazie, jeszcze 38% firm.
- Ograniczenia 3th party data wynikające min. z rosnącej wagi prywatności danych, ograniczeń cookies oraz wzrastająca wagą 1st party data w personalizacji, kierowaniu i optymalizacji reklam wymuszają budowę repozytorium danych o produktach.
- SKU
- przychody
- wydatki reklamowe
- szerokość sprzedaży (liczba kanałów reklamowych, rynków)
- ilość systemów, które pobierają informacje o produktach
- waga Google BigQuery w ekosystemie danych e-commerce
To powoduje, że Data Octopus jest najbardziej “lepki” dla średniego i wysokiego segmentu e-commerce.
Jeśli jeszcze nie szukałeś pola do performance swojej sprzedaży e-commerce w efekcie Feed marketingu, to mamy dwie informacje. Pierwsza jest taka że na pewno masz tutaj pole na performance i na pewno Data Octopus pozwoli Ci je wykorzystać do maksimum. Druga jest taka, że prawdopodobnie tracisz codziennie pieniądze i warto to zmienić. Data Octopus jest szczególnie skuteczny w przypadku sprzedaży dużej oferty na wielu rynkach poprzez wiele kanałów reklamowych. Tam, gdzie zaczynają się kończyć popularne aplikacje tam zaczyna się Data Octopus, dla którego im więcej danych i większa dynamika ich przetwarzania, tym większa wartość dla Ciebie.
Dodatkowym wyzwaniem jest utrzymanie integracji oraz higiena danych. Pracując od wielu lat z biznesem typu e-commerce zauważyliśmy, że część danych przechowywanych jest w plikach Google sheets, część w systemie ERP, systemie magazynowym, silniku sklepowym, Google Analytics czy Google Ads. Wyzwaniem jest powiązanie tych danych w obrębie jednego produktu, a tym samym praktyczne wykorzystanie, które daje realne wsparcie w analizie i planowaniu biznesu.
Rozpoczęcie optymalizacji plików produktowych pod popularne kanały reklamowe jest dostępne niemal natychmiast. Zaprojektowanie i uruchomienie Data Warehouse - zwłaszcza jeśli okaże się, że wymagasz customizowanych integracji, zajmie od kilku dni do kilku tygodni. Od strony technologicznej zrobiliśmy wszystko, aby przebiegało to możliwie sprawnie i łatwo.


 E-commerce
  Agencja Digital Marketingowa
  Lider E-commerce
  Specjalista PPC & Marketing
  Analityk


