In the previous articles I wrote about comparing products in an e-commerce offering to football players running on the field. Now, I would like to delve deeper into the strategic area, specifically how to assess the current state and plan changes that will achieve specific business goals.
Only 2% of Marketers Use Margin Knowledge
According to a report prepared by Data Feed Watch based on thousands of online stores:
Only 15% of marketers use more than one data source when segmenting e-commerce products, and only 2% of those who do so base their segmentation on product margin
Multichannel Marketing Report 2023
How should this be understood? There are at least two conclusions. Only 15% of marketers use a broader data context for products than what comes from the basic product feed. This means that the majority do not attempt to feed the advertising system’s AI with anything beyond the basic and required data. This is a big mistake because, first, it limits the effectiveness of sales, and second, it reduces managerial control over sales priorities. The result of this and many other decisions is that, in practice, a narrow segment of the offering is most often sold, while many products simply remain in the warehouse without sufficient sales opportunities.
The second conclusion directly relates to the importance of product margin. Unfortunately, most marketers primarily optimize for ROAS while neglecting profit and margin. Margin knowledge is a critical piece of information that should influence product scoring and sales strategy. For years, we have observed an endless optimization for the best possible ROAS. This is not a type of optimization that can continue indefinitely, and at some point, it will become less effective as a large amount of work will lead to diminishing returns. This can be compared to the red ocean vs. blue ocean strategy, where optimizing and fighting for ROAS is akin to competing in a very crowded, “red ocean.”
Of course, this must be done, and the relationship between advertising costs and revenue has been, is, and will long remain a fundamental metric in digital marketing, but it should not distort our perspective or monopolize all actions.
For years, during the e-commerce boom, it took little effort to achieve good results. By “good,” I mean growth and, at the end of the day, profit appearing in the account. However, the market is becoming more professional, meaning there is increasing competition not only from domestic capital, but also from more demanding customers, rising rates, shrinking margins, growing operational costs, and so on.
In the face of increasing pressure in e-commerce and the growing amount of data, it is worth seeking potential for business growth in areas that were not so strongly required before, such as managing product sales strategies based on data. Of course, this has always been happening, but today the responsiveness and effectiveness of AI embedded in advertising systems is even higher and even more positively (and negatively) influenced by the input data. It should be the marketer’s interest to take care of this data just as they should take care of a good prompt. As more and more changes in the account occur as a result of automation and AI, the marketer’s role shifts more towards responsibility for strategy and good data.
Are there any data that prove the potential of this thesis? Here you go:
66.6% of advertisers exclude unprofitable products from paid campaigns.
Multichannel Marketing Report 2023
33.4% of advertisers still do not do this. Of course, it’s not possible to definitively answer at such a general level whether this is good or bad because it depends. However, it is certainly not good to lack such knowledge, not to calculate it, and not to do anything with it. How large or small can the scale of unprofitable products be? Before I attempt to answer this question, let me provide a brief introduction.
Up to 85% of Sold Products Generate a Loss
By unprofitable products, we mean those that, after deducting advertising costs and accounting for margin, result in a net sales figure lower than their total net sales over a given period.
Profit Rank = (net sales value + margin) – advertising costs
What do you think the percentage of unprofitable products might be? The median of the stores we analyzed was 85%. Yes, in the stores we analyzed, 85% of products that were sold were sold at a loss. In such a situation, it is obviously necessary to delve deeper into the analysis to determine the cause. Perhaps the traffic was improperly targeted, maybe there are poor descriptions or images, or perhaps the product didn’t sell well within the system that generated the traffic but supported the sale of another product in a different channel, etc.
Do you find the above data interesting? I hope you will also find the following ones intriguing.
33% is the median of products in an e-commerce offering that generate costs but do not bring in even 1 PLN in revenue
Internal Analysis by Data Octopus
40% is the median of products in an e-commerce offering that are not even advertised by the system and generate no costs or revenue
Internal Analysis by Data Octopus
15% is the median of products in an e-commerce offering that generate profit after accounting for margin
Internal Analysis by Data Octopus
Activating Margin Knowledge: Building a Master Model
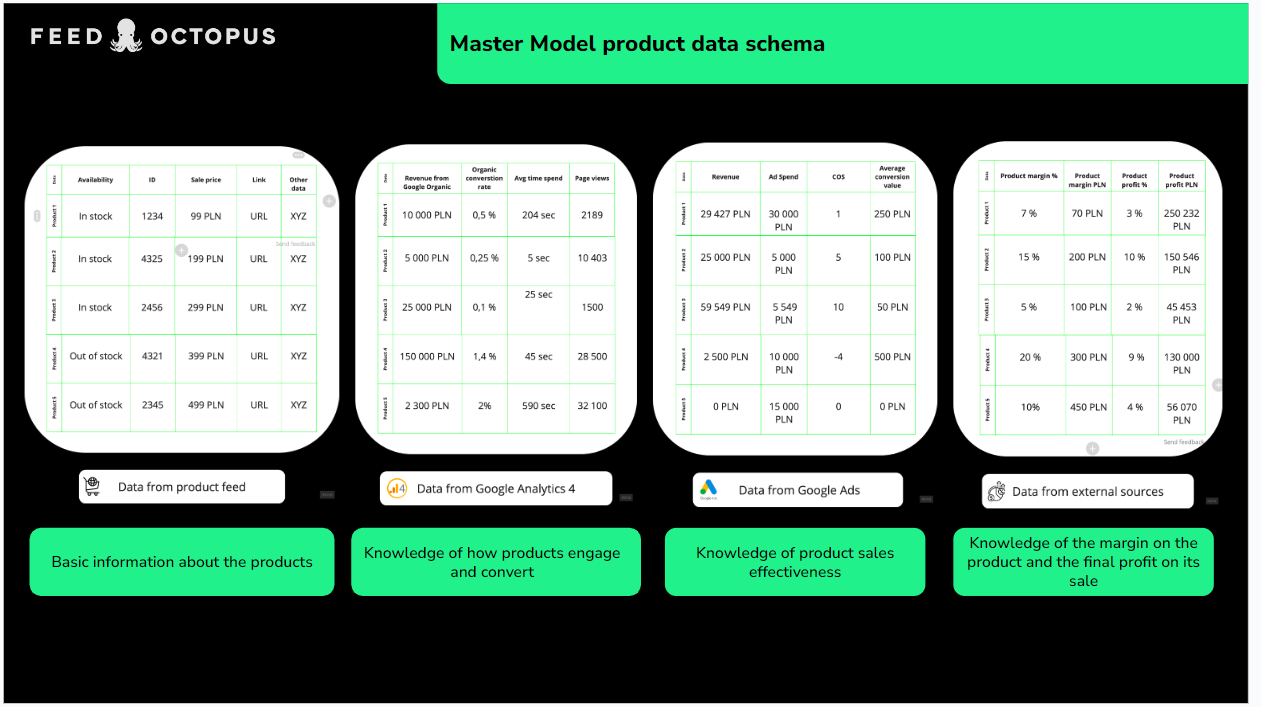
If you already understand how important margin knowledge is from a business and strategic perspective, you might be asking yourself, HOW to use it? Before I answer that using the Data Octopus example, I’ll add that the method is quite universal and doesn’t necessarily apply only to margin. It can apply to any important product data that you want to consider when segmenting and managing sales. Sometimes it’s inventory aging, sometimes it’s a brand whose sales are of particular interest, or the return rate. What we invite you to do is to build a master model of product data that aggregates key information about the product not only from the product feed but also from systems such as:
- Advertising system
- E-commerce engine
- ERP/CRM system
- Others
The graphic below illustrates the flow of product data on a high-level overview. Alongside Data Octopus, we use Google BigQuery as the main data warehouse where we aggregate and process the data. More about Google BigQuery here.
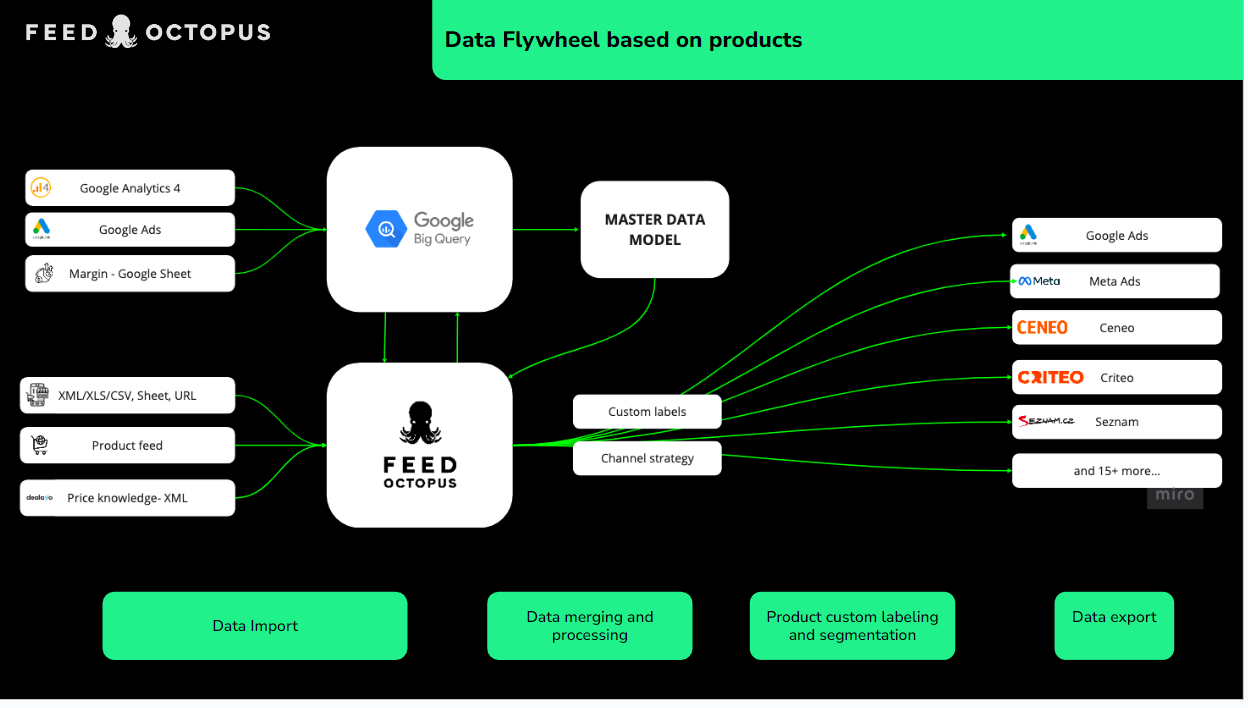
The master data model can consist of product data from Google Ads, Google Analytics 4, the product feed, as well as additional sources such as the e-commerce system, Google Sheets, XML/XLS, URLs, etc. A major advantage is the high frequency of data retrieval and the scalable environment.
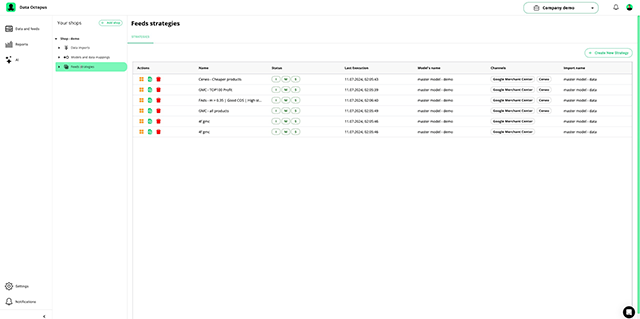
The structure below shows an advertising account, where products are mainly distributed based on their contribution to sales and the ROAS level, i.e., the profitability of achieving that sales.
- We move “Zombie Products” to a separate campaign, which at the settings level addresses the goal we want to achieve for these products. The goal is to kickstart their sales, although it’s not usually the case that these products have no sales at all.
- A similar situation applies to “No Purchase” products. These are also products that require a boost because they are not selling at all. From tests and experience, we know that both of the above campaigns can quickly deliver very interesting results if the products are properly assigned to them and the campaigns are well-configured.
- The further matrix assigns all products achieving a certain sales level to one of nine campaigns. The campaign mainly depends on the ROAS and sales level that a given product achieves over a specific period.
Similarly, instead of considering Revenue or Performance Rank, you could take into account the conversion rate at the product level or Profit Rank. However, we have developed certain methods and strategies through collaboration with clients that work well at various stages of an online store’s development and objectives.
Product Sales Performance Analysis
To establish a baseline, we usually start by assessing the sales performance of products. The result is a report that can already reveal a lot about the situation of the account. Below are excerpts from reports of various accounts we have analyzed:
- 69% of products did not sell at all in the last 90 days.
- 11% is the budget invested in the sale of products that resulted in zero sales.
- 31% of the offer consists of products that generate sales. 89% of the advertising budget was invested in these products, which is a very good result compared to other stores we have analyzed. Often, the budget invested in zero sales can be well above 50%.
- As much as 60% of the sold products do not generate profit after accounting for the sales margin.
- Budgets invested in unprofitable products are larger than those in products that generate profit.
What we encourage is to start optimizing for profit, not just ROAS or revenue. In an era of rising e-commerce costs and shrinking margins, profit becomes more important than business scale. In times of cheap money and high margins, it may have less significance, but in recent years its strategic importance has grown. Not every e-commerce business remembers this, which is why we see such high turnover in the market (many enter, and just as many leave within two years).
Revenue Rank Combined with Profit Rank
The graphic above illustrates the assignment of each product in an e-commerce offering to one of four baskets. A product, due to its weight in revenue, can be placed in the High, Mid, Low, or No Revenue segment if it generates no sales at all. This is an example of segmentation based on revenue contribution. Similarly, product segmentation can be built based on profit contribution, dividing them into baskets of products that generate profit at a certain level (High, Mid, Low) or generate a loss. An interesting analysis is when we combine Revenue Rank with Profit Rank and examine how products in the high-revenue basket impact profit. From the above graphic, we can observe that:
- Products that do not generate sales consume the most impressions on the account.
- Products that do not generate sales consume 34% of the total advertising budget. The products generating the most revenue only consume 41%. Even less is spent on those in the lower Revenue segments.
- The MID Revenue segment generates very little and very expensive sales. There are certainly products with potential there, but they need to be identified based on data and moved to the appropriate campaign. After an incubation period, they can potentially be moved to another campaign.
- Only 9% of products are in a single campaign.
- 73% of products are in at least three campaigns.
It is impossible to definitively answer whether this is good or bad without context. However, tests and experience tell us that if an advertising system receives too many sometimes conflicting signals, it does not help. What is the primary goal for this product now? Increase impressions? Scale sales without budget constraints? Data, automation, and segmentation help manage this.
Unlock the Potential of Data and Start Optimizing for Profit
I hope this article has inspired you to start collecting and activating product data differently. If you already have it, that’s even better because it can be implemented faster and fed into advertising systems, which need it like fuel. Is it worth focusing primarily on ROAS, chasing ever-increasing revenue? It definitely needs to be continued, but the answer to growth can also be found in product-level and margin optimization. In an era of shrinking margins and increasing competition, this is what determines whether profit will appear in the account.